
The Tariff-Dollar Decoupling: Extracting the Geopolitical Risk Premium via Real Yield Decomposition (in Python)
Why the dollar is weaker than real yields predict, and how to quantify it

The dollar should be stronger than it is. The 10-year real yield is sitting at 1.97%, the curve has steepened to 52 basis points, and the Fed hasn't cut aggressively. By any conventional rates framework, that combination points to a stronger dollar. Instead, it's down 7% from its January 2025 peak. Something is doing work that yield differentials can't explain, and quantifying that something is what this project is about.
The goal of this project was to build that framework from scratch using only public FRED data and Python, apply it to the current macro environment, and extract what I’ll call the Geopolitical Dollar Risk Premium.
Section 1: The Decomposition Identity
The issue with using nominal yields to explain the dollar is that nominal yields contain multiple distinct signals bundled together. Real yield reflects actual growth and return expectations. Breakeven inflation reflects where markets think prices are heading. Yield curve slope reflects the expected path of monetary policy and risk appetite. Mixing all of that into one number and running it against the dollar loses information.
The decomposition starts with the Fisher equation written in daily changes:
Before building anything, it's worth checking this actually holds in the data. Using FRED series DFII10 (10Y TIPS real yield), T10YIE (10Y breakeven), and DGS10 (10Y nominal Treasury) across 2,153 business days from 2018 to April 2026, the correlation between the left and right side is 0.99994 with a mean absolute error of 0.00093 basis points. Any small residual is a TIPS liquidity/measurement artifact. At a MAE of 0.00093 basis points and R² of 0.99994, it's negligible for any practical purpose, and the identity holds tightly enough to use as a decomposition foundation.
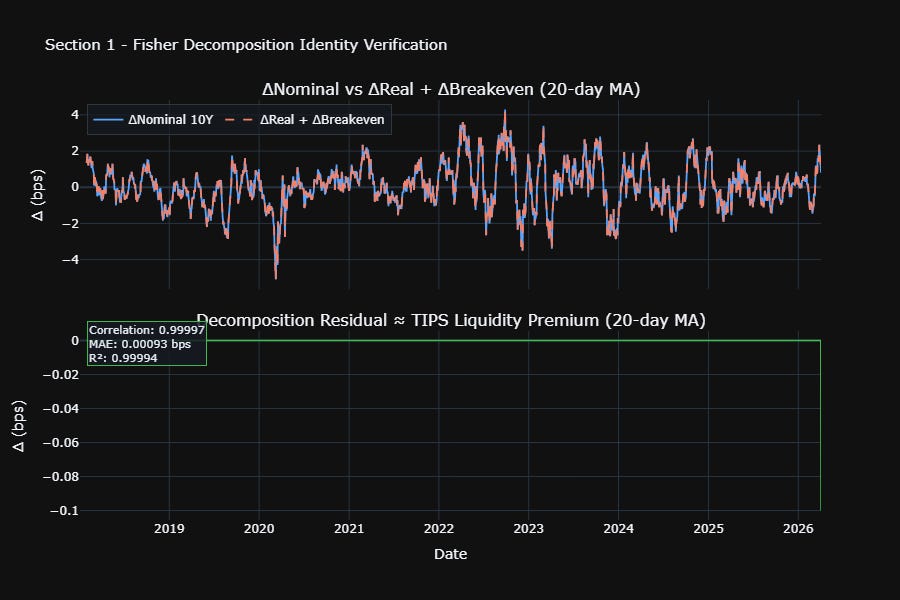
The two lines in the top panel of Figure 1 are nearly indistinguishable, which is the point. The bottom panel shows the residual sitting close to zero across the full sample. With the identity confirmed, the trading model for the broad dollar (DTWEXBGS - the Fed's Nominal Broad U.S. Dollar Index, covering 26 currencies) becomes:
Each factor is doing different work. Real yield captures the return channel: when real yields rise, the dollar tends to attract capital flows and strengthen. Breakeven captures the inflation channel: higher inflation expectations erode purchasing power, theoretically weakening the dollar. Slope (2s10s) captures forward growth expectations and how aggressively the market expects the Fed to move.
Section 2: The Rolling Regression
Running the full-sample OLS from 2018 to April 2026 gives an immediate and important result: R2 = 0.060. The three rate factors, despite being highly significant as a group (F-stat = 45.82, p = 10-28), explain only 6% of daily dollar variance.
Looking at the individual coefficients, real yield does most of the work: a 1bp rise in the 10-year TIPS yield is associated with a +0.0148% move in the broad dollar (t = 11.0, p < 0.0001). Breakeven is insignificant at daily frequency (p = 0.25), which makes sense intuitively since inflation expectations are slower-moving and their dollar impact is less direct day-to-day. Slope is significant and negative (beta = -0.73, p < 0.0001): a steeper curve weakens the dollar, consistent with curve steepening being a risk-on signal that reduces safe-haven demand.
The low R2 isn’t a problem though. It’s actually the core point. Most dollar moves aren’t rate-driven, and the 60-day rolling regression in Figure 2 shows exactly when rates matter and when they don’t.
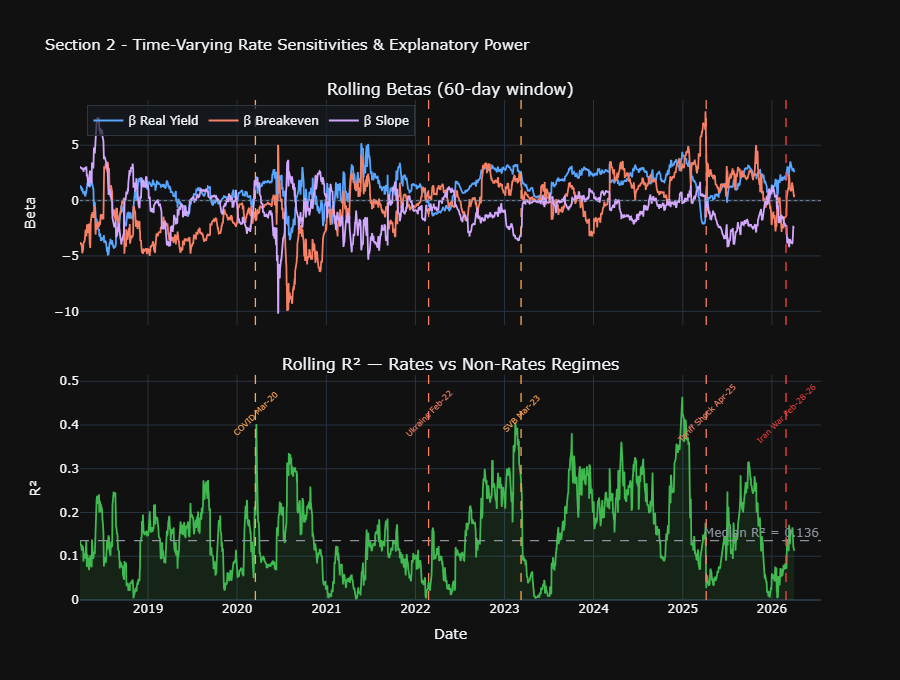
The median rolling R2 across the sample is 0.136, so in a normal regime, rate factors explain roughly one in seven daily dollar moves. The range visible in Figure 2 is striking: a minimum of 0.002 on May 3, 2021 (when the Fed had rates pinned near zero and dollar moves were almost entirely idiosyncratic) to a maximum of 0.464 on December 30, 2024. The COVID period is also where the rolling betas go haywire - the breakeven beta briefly drops to nearly -10, which isn't a meaningful economic signal so much as the model breaking down when markets were in pure panic mode and correlations went to zero or reversed. That instability is itself informative. That December 2024 peak is the obvious standout in the bottom panel of Figure 2. The post-election dollar surge in Q4 2024 was the cleanest rates-driven regime in the full sample. Real yields and the curve explained nearly half of daily dollar variation. Then 2025 happened.
At the far right of Figure 2, the R² drops back below the median dashed line almost immediately after the Iran War event line - the current reading is 0.113. The safe-haven dollar move fired but didn't produce a sustained rates-driven regime. The real yield beta has widened to +2.56 and the slope beta to -2.36, both substantially larger in magnitude than their full-sample averages. The model is more sensitive to rate moves but explaining less variance than usual. That gap is where the GDRP comes from.
Section 3: The Geopolitical Dollar Risk Premium
The full-sample OLS residual, z-scored to make it comparable across time, is what I'm calling the Geopolitical Dollar Risk Premium (GDRP). A positive reading means the dollar is trading above what rate factors predict: safe-haven demand beyond what yields justify. A negative reading means the dollar is weaker than rates alone would predict: a political or geopolitical discount that the rates model can't capture. The GDRP uses full-sample OLS residuals and is an in-sample decomposition designed for retrospective regime analysis, not a real-time tradeable signal.
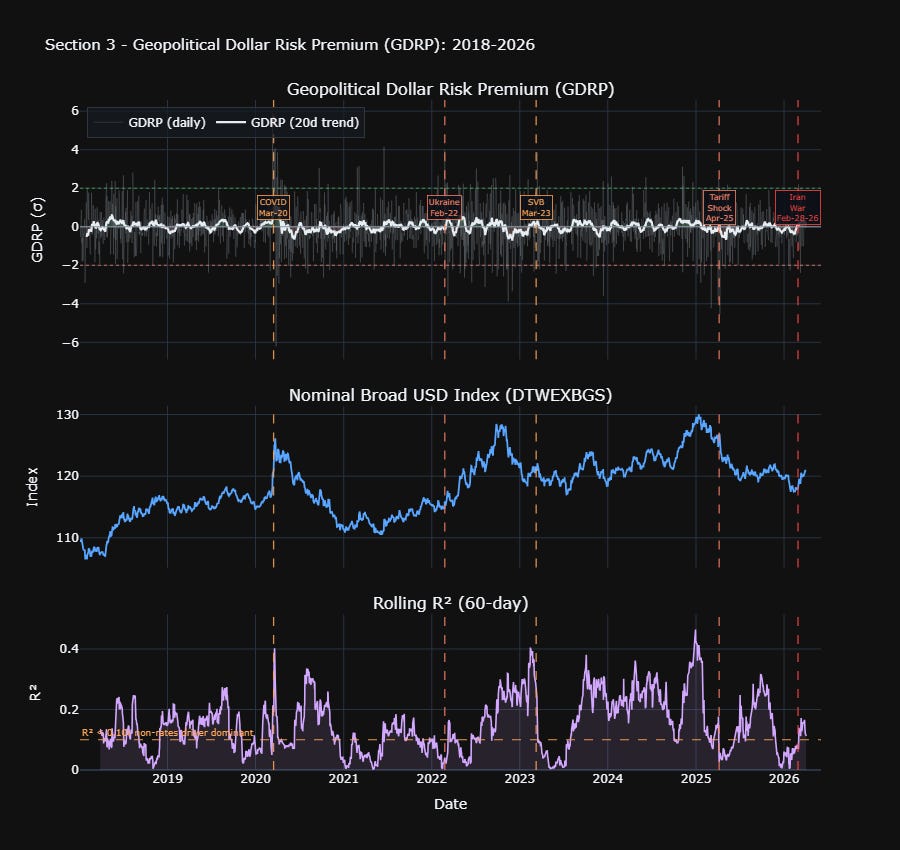
The annual averages in the GDRP panel of Figure 3 give a clean macro narrative:
2025 stands out, though the signal is subtle. The GDRP trend line in Figure 3 doesn’t make dramatic swings - it stays close to zero throughout. But the direction is consistent: 2025 produced the most persistently negative annual average in the full sample at -0.083σ, meaning the dollar was, on balance, trading slightly below what real yields and the curve predicted across the whole year. In a z-scored residual framework, persistent direction matters more than magnitude. A CEPR paper1 published in January 2026 found that the April 2025 tariff shock caused the 10-year Treasury convenience yield to drop nearly 10 basis points, with an unprecedented divergence between the 2-year and 10-year convenience yield spreads. That erosion of safe-haven status shows up directly in the GDRP turning negative and staying there through 2025.
The middle panel of Figure 3 makes the macro tension visible directly. The broad dollar peaked around 130 in early 2025 and has since fallen back to 120.89, while the bottom panel shows R² collapsing from its December 2024 peak of 0.46 back toward the median. The dollar level and the rates model are diverging - that divergence is what the GDRP trend in the top panel is capturing, even if the signal looks quiet relative to the daily noise.
As of April 3, 2026, the 20-day GDRP trend is +0.133σ at the 72.4th percentile. This is the Iran war effect. When the US-Israel military campaign against Iran began on February 28, 2026, markets responded with a flight to dollars, pushing the GDRP back into positive territory. But the 2026 annual average of -0.012σ tells the broader story: the reflex fired, but it hasn't fully overcome the structural discount left by 2025.
The crisis event study in Figure 4 puts numbers on this directly.
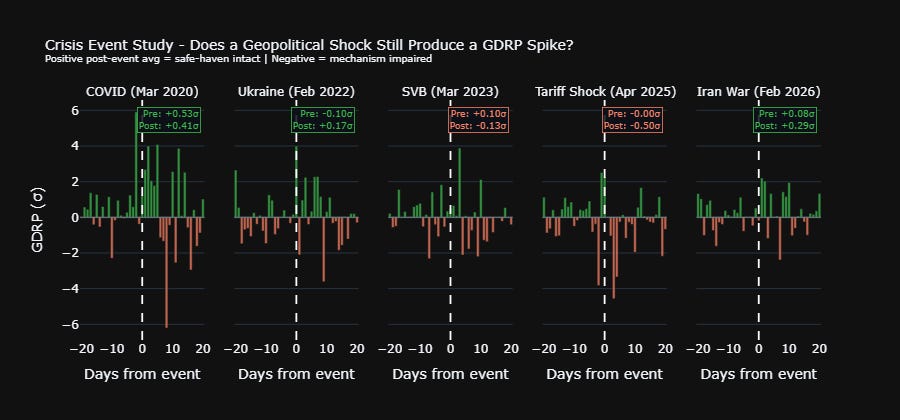
Looking at the post-event averages in Figure 4: COVID produced a strong positive spike (+0.41σ), consistent with panic-driven safe-haven demand. Ukraine was more modest (+0.17σ), which is interesting given how geopolitically significant it was - the hawkish Fed backdrop at the time may have muddied the safe-haven signal. SVB turned slightly negative (-0.13σ), which makes sense since a domestic banking shock raises Fed-cut expectations and weakens the dollar through the rates channel rather than strengthening it as a safe haven. The Tariff Shock is the standout: a post-event average of -0.50σ is the most negative reading in the study by some distance, showing clear impairment of the safe-haven mechanism. The Iran War then produced the largest post-event spike of any shock in the sample at +0.29σ, bigger than Ukraine.
The key takeaway from Figure 4 isn't that the Iran War safe-haven spike is weaker than Ukraine - it's actually stronger. The real story is the Tariff Shock sitting at -0.50σ post-event, the only panel in the study that clearly shows the safe-haven mechanism breaking down. The Iran War then firing at +0.29σ suggests the reflex recovered, but the 2026 annual GDRP is still slightly negative because the tariff shock damage from 2025 hadn't fully unwound before the war began. The sequence matters: tariff shock breaks the mechanism, Iran War partially restores it, but the structural discount from 2025 is still visible in the annual average.
Conclusion
The broad dollar index sits at 120.89 as of April 3, 2026, down 7.0% from its January 2025 peak of 130.04. The 10-year real yield is 1.97%, the term premium is 0.72%, and the curve has steepened to 52 basis points. A near-2% real yield would normally support a stronger dollar. The GDRP framework gives a quantitative explanation for why it isn't, even if the signal in the trend line is subtle rather than dramatic. The direction is what matters here, not the magnitude.
The Iran War produced the strongest post-event safe-haven response in the sample at +0.29σ, larger than Ukraine 2022, which shows the reflex isn't dead. But that spike came after the Tariff Shock recorded -0.50σ in 2025, the only event in the study where the mechanism visibly broke down. The 2026 annual average is still slightly negative, the rolling R² is below its historical median, and the tariff uncertainty persists. What’s interesting is that this is genuinely unresolved in real time. The GDRP framework won’t tell you where the dollar goes next, but it will tell you what the market is pricing as the driver, and right now it's pricing a recovery from the 2025 tariff damage that isn't complete yet. The Iran War fired the safe-haven reflex. Whether it stays fired as the tariff backdrop persists is the open question, and the GDRP will show it before anything else does.
Thanks for reading!
Click here for the Github repository containing the Jupyter Notebook.
All data from FRED public API. Dollar series: DTWEXBGS (Nominal Broad U.S. Dollar Index). Real yield: DFII10. Breakeven: T10YIE. Nominal 10Y: DGS10. Full-sample OLS on 2,153 daily observations, 2018 to April 2026. Rolling window: 60 business days. GDRP is the z-scored residual of the full-sample regression. Code in the accompanying Jupyter notebook.
Viral V. Acharya and Toomas Laarits, "Tariff War Shock and the Convenience Yield of US Treasuries — A Hedging Perspective," NBER Working Paper 34640 (2026), https://doi.org/10.3386/w34640.